Overview
Radbridge conducts visitation and economic impact assessments for parks and open space. While much of our work has been system- or state-wide, recent improvements to our data pipeline and processing infrastructure now let us deliver site-specific analyses for one or more parks on a short timeline.
A Park Visitation Snapshot applies our established ETL (Extract, Transform, Load) and quality-control process to anonymized mobile location data and produces a concise 8–10 page PDF for each park. The report summarizes temporal visitation patterns, dwell-time ranges, and visitor origin and travel-distance profiles. Results are presented in clear charts with key takeaways to support agency decision making. For a limited time, 1 year of dashboard access is included with any Park Visitation Snapshot.
Use Cases and Benefits
Data-Driven Decisions
Use real visitation patterns—not guesses—to guide master planning, operations, and programming. Short, clear charts show when people come, how long they stay, and where they come from.
Community Access & Experience
See who you’re reaching (via neighborhood-level demographics) and how use varies across the site. Spot gaps, improve access, and make small changes that lift the visitor experience.
Justify Funding & Investment
Provide concrete numbers for grants, budget proposals, and briefings—visitation over time, regional draw, and high-level demographics—with publication-ready visuals and a robust method.
How it works
1. Define the park
Provide a boundary file or let us confirm/draw one with you. We'll then schedule a kickoff meeting to confirm your scope and goals, execute a simple agreement, and get started.
2. Process the data
We acquire anonymized mobile location data and run it through our established ETL pipeline, removing noise and isolating genuine park visits to analyze when, where, and how people use your site.
3. Deliver the results
We prepare the PDF and enable dashboard access, typically within three business days of scope confirmation and agreement execution.
What you receive
Pricing
Our pricing is structured to provide cost-effective insights for one or more parks. Listed prices include data procurement, analysis, and report preparation. For a limited time, 1 year of dashboard access is included with any purchase.
Add-on Services
Beyond single-park snapshots, we also offer system-wide, regional, and state-level analyses. Contact us to discuss custom scopes and add-on services, including:
-
Economic Impact Analysis
Estimate visitor spending, job support, and tax revenue using established methods.
-
Public Health Benefits Analysis
Measure non-market values like consumer surplus and avoided healthcare costs.
-
Environmental Benefits Analysis
Quantify ecosystem service values associated with your park or open space.
Meet the Team
Radbridge was founded by Rowan Schmidt and Johnny Mojica, who have worked together for more than a decade advancing outdoor recreation, economic development, and community resilience. Before launching Radbridge in 2022, they worked together for 8 years in the nonprofit sector, supporting government agencies across the country with visitation studies, economic impact assessments, and benefit-cost analyses.
Together, they've processed hundreds of billions of mobile location records, pioneered new methods for measuring the benefits of parks, built software products, and helped agencies secure hundreds of millions in funding for resilience projects. Their work combines rigorous data science with a deep understanding of what government and nonprofit clients need—clear answers, defensible methods, and insights that support real-world decision making.


Selected Projects
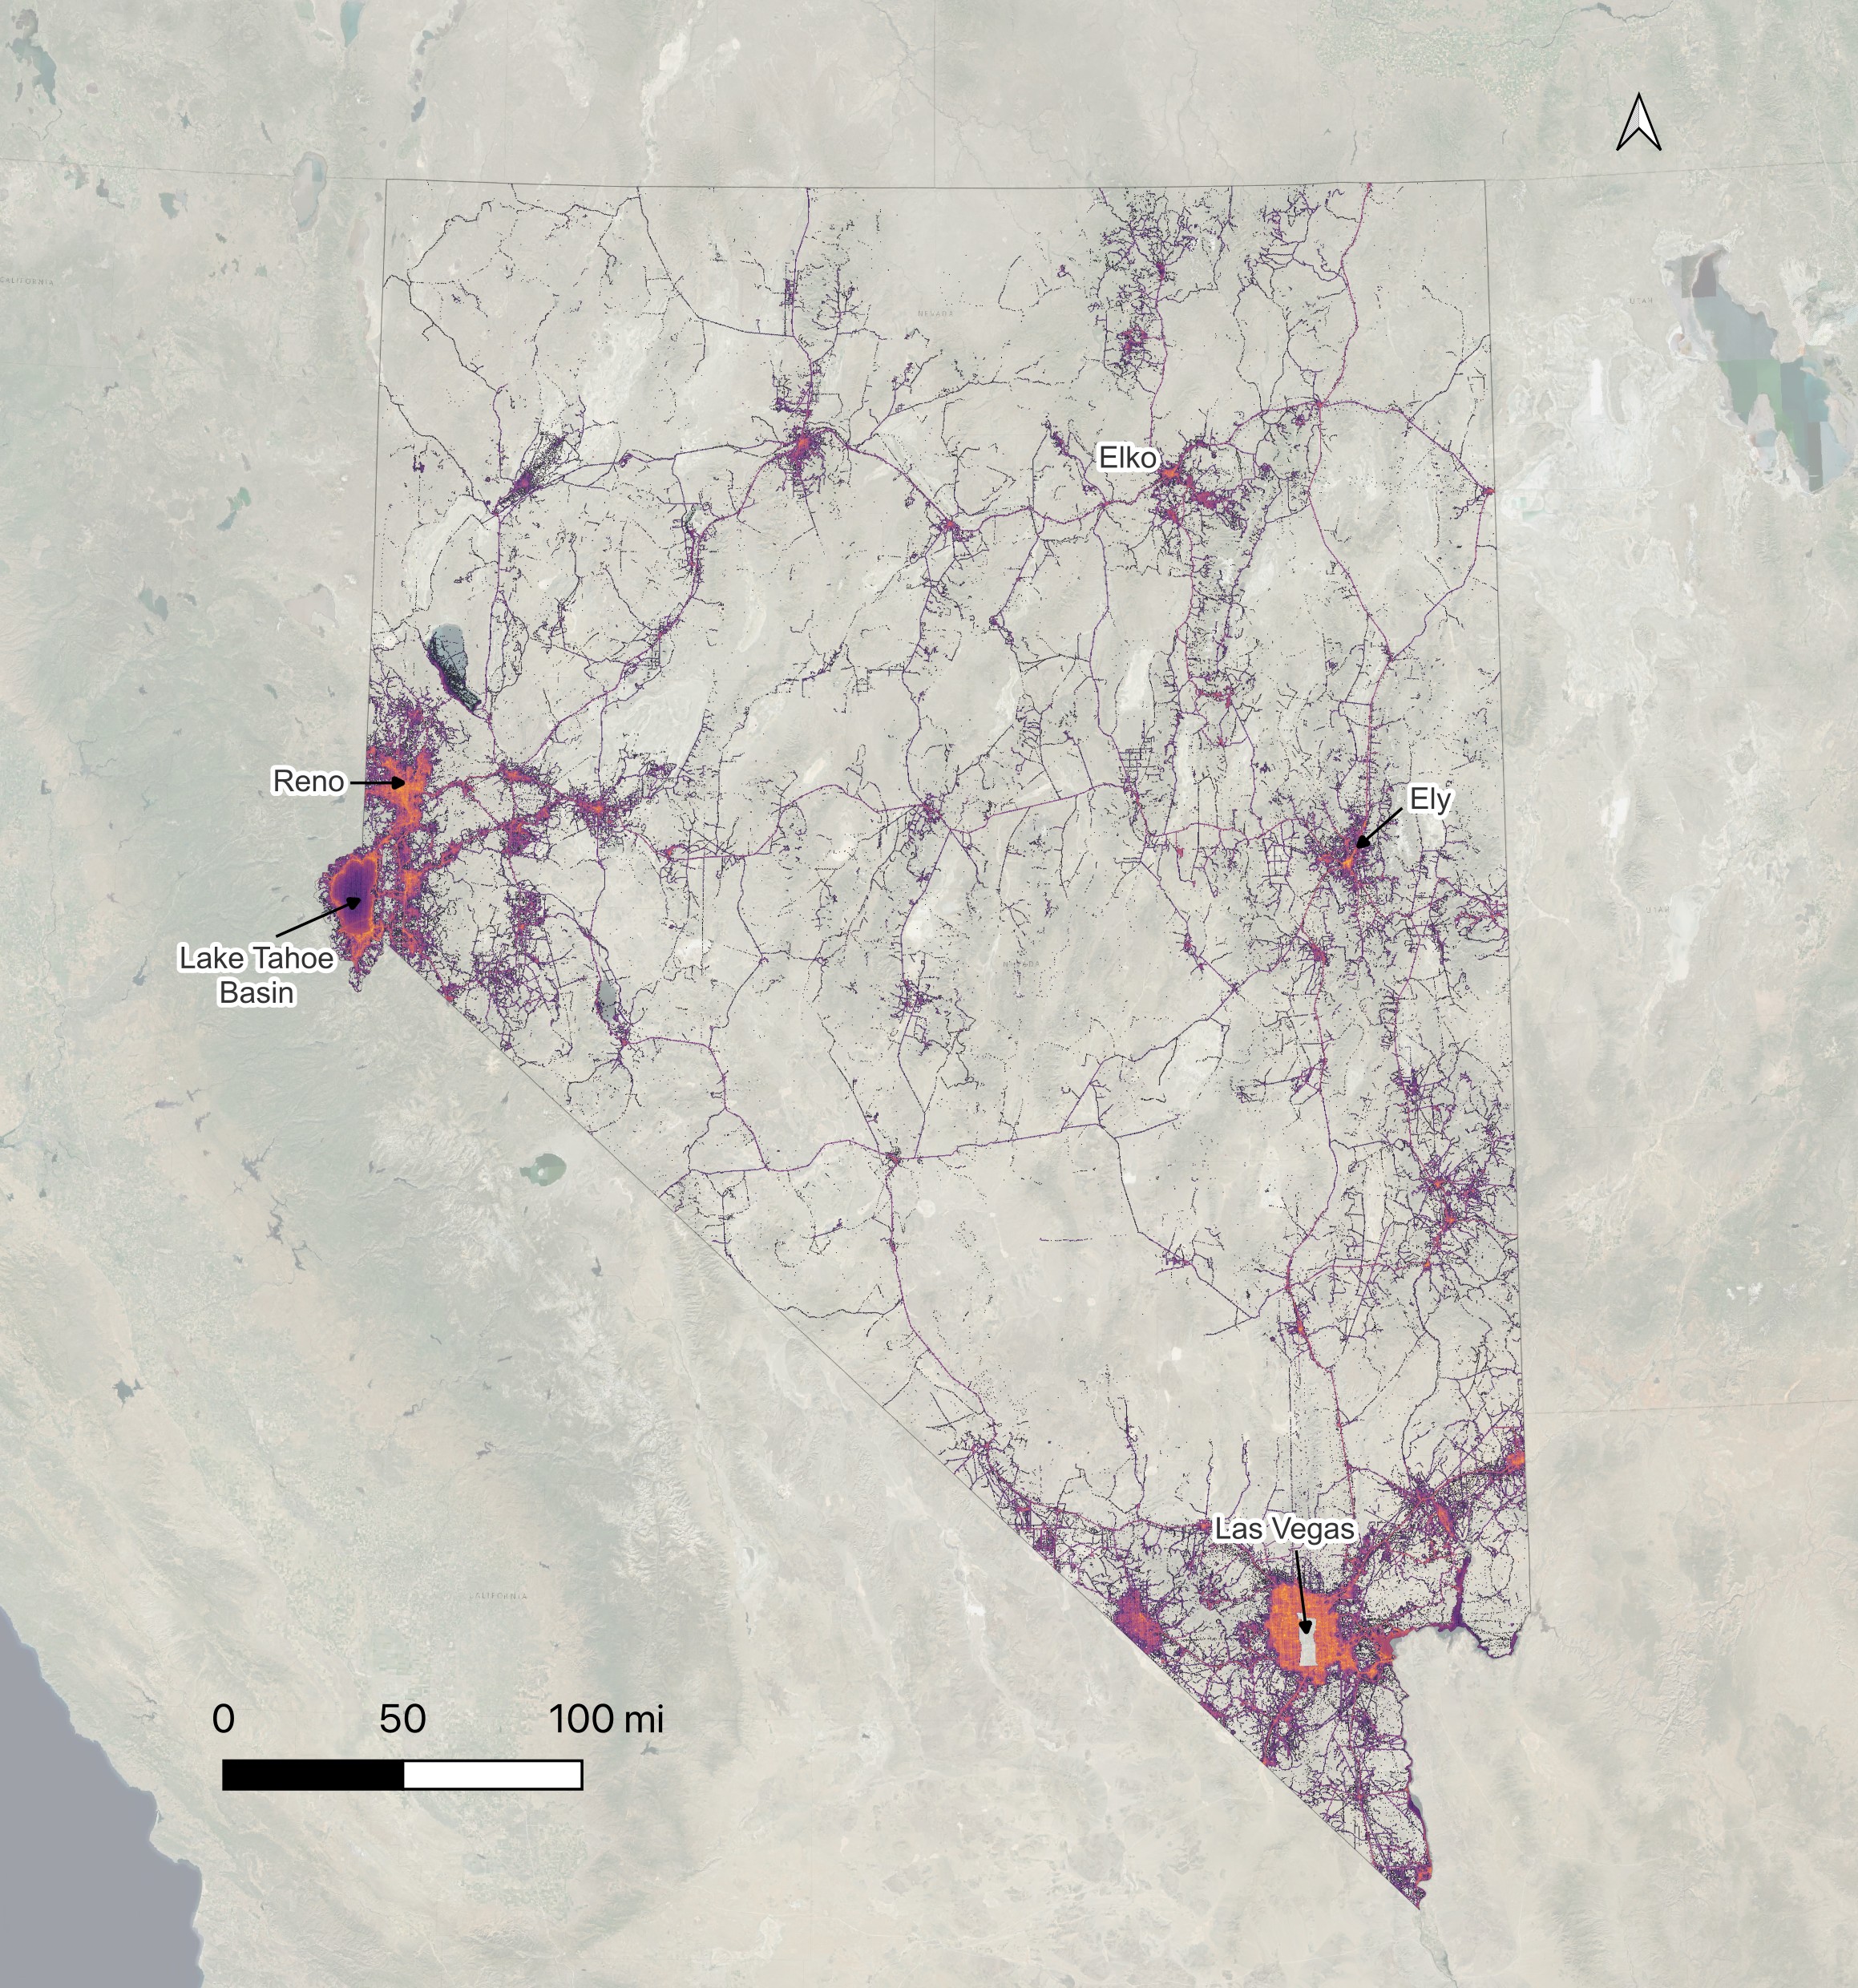
Outdoor Recreation in Nevada
Statewide assessment for Nevada Division of Outdoor Recreation. Processed 80 billion mobile location records to quantify $7.67B in economic output and 159 million annual visits across 1,500 recreation sites.
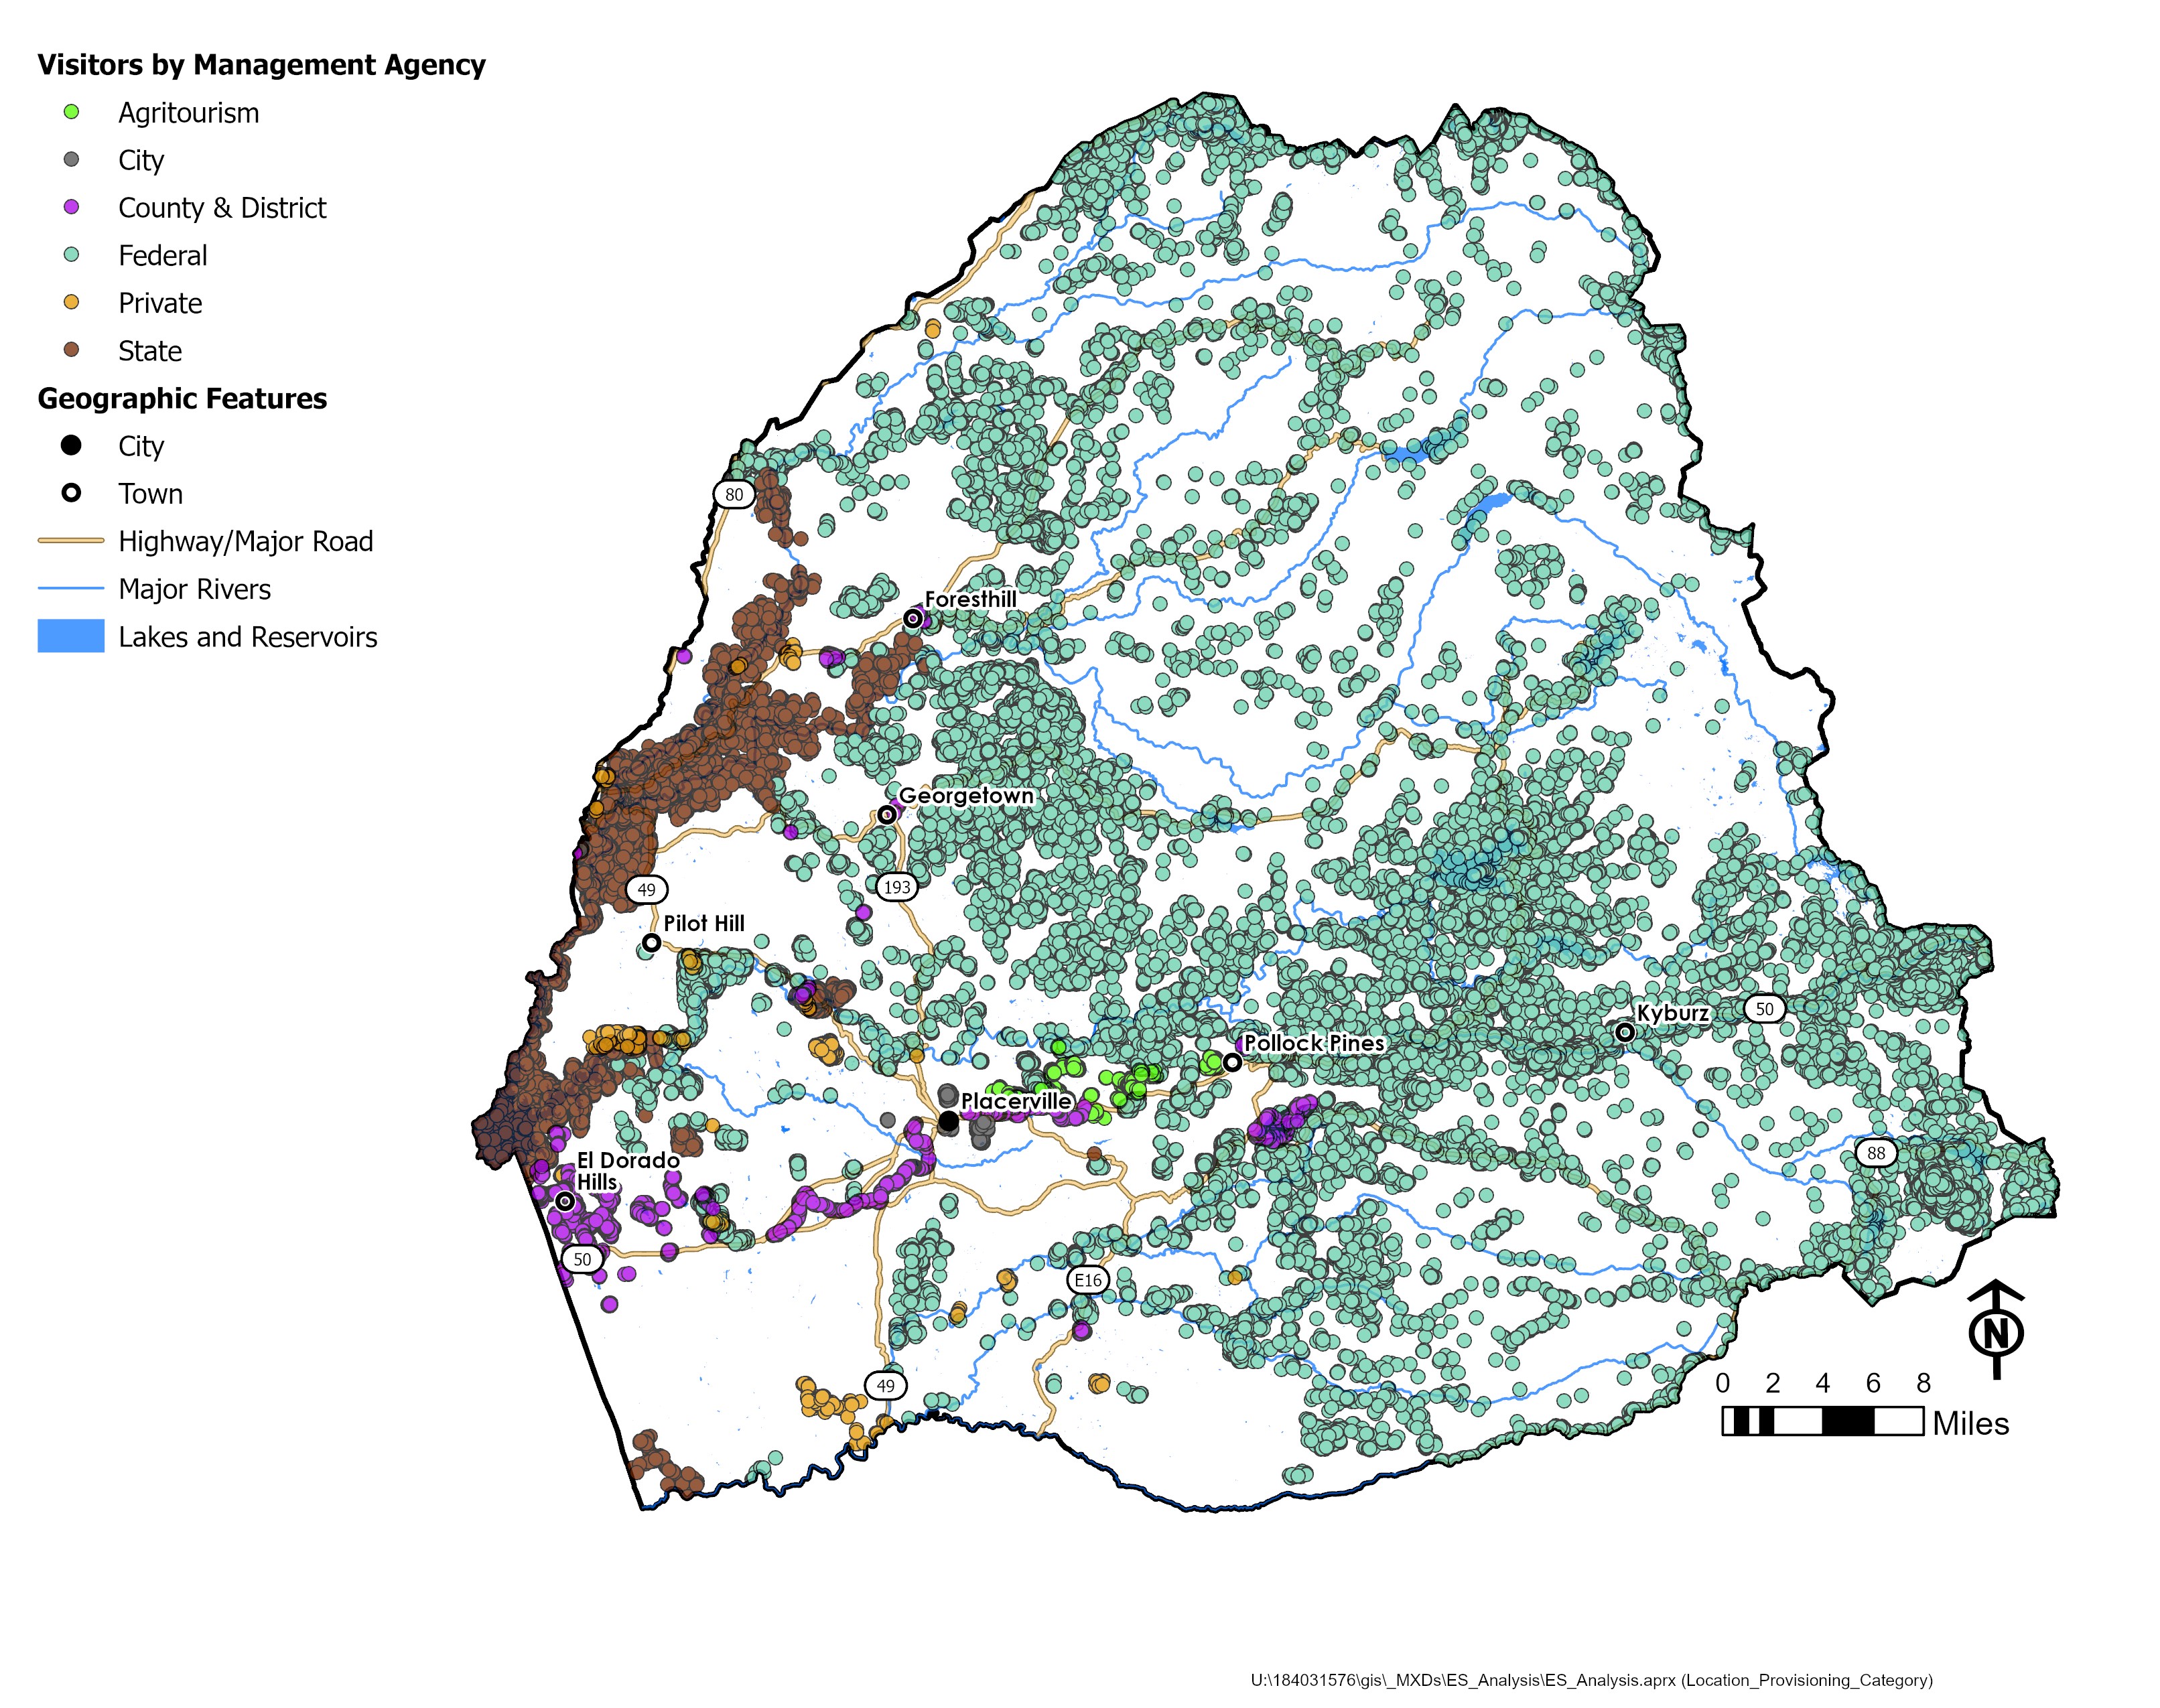
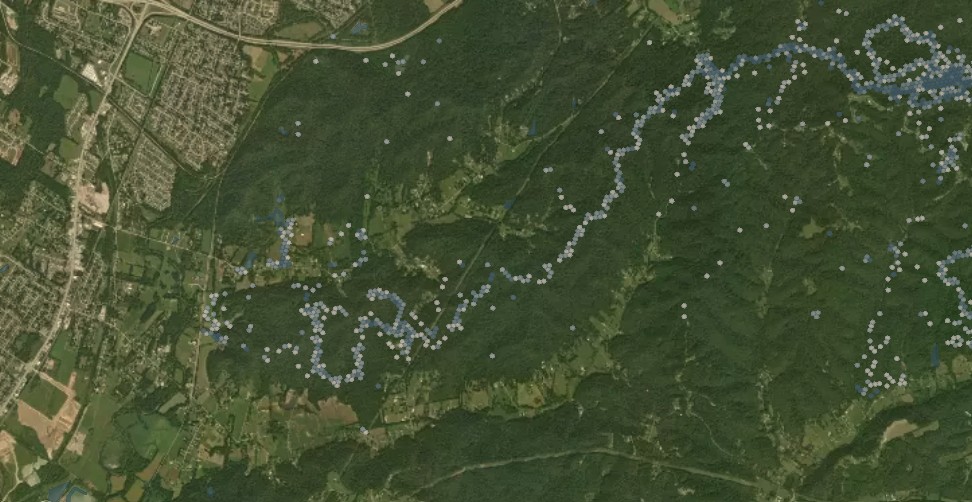
Upper American River Watershed
Comprehensive recreation analysis for El Dorado Water Agency. Processed 560 million mobile records and used machine learning to estimate 7 million annual visits generating $348M in economic impact.
ICON Water Trails Network
Economic benefits and visitation analysis for 150-mile river network in Central Iowa. Pioneered methodology to differentiate river users from shore-based visitors across 2.6 billion mobile records.
FAQ
All data is fully anonymized and aggregated. Individual devices cannot be identified, and all processing adheres to strict privacy protocols. We only report aggregate statistics that meet minimum threshold requirements.
Yes! We offer volume discounts for 2, 3, or more parks. Contact us for custom multi-park pricing that fits your system's needs.
We work with you to define appropriate boundaries using GIS data, satellite imagery, and your input. Our spatial cleaning process accounts for roads, private inholdings, and other exclusions.
Economic impact assessment is available as an add-on service. This includes visitor spending estimates, job support calculations, and tax revenue modeling based on established methods.
Our comprehensive studies, such as our recent statwide study in Nevada, can include systemwide coverage, calibration of visitation data through machine learning modeling, economic impact analysis, and extensive stakeholder engagement. The Park Visitation Snapshot focuses on one or a few locations with a streamlined process and fixed deliverables, making it quick and cost effective.