Overview
Radbridge conducts visitation and economic impact assessments for parks and open space. While much of our work has been system- or state-wide, recent improvements to our data pipeline and processing infrastructure now let us deliver site-specific analyses for one or more parks on a short timeline.
A Park Visitation Snapshot applies our established ETL and quality-control process to anonymized mobile location data and produces a concise 8–10 page PDF for each park. The report summarizes temporal visitation patterns, dwell-time ranges, and visitor origin and travel-distance profiles. Results are presented in clear charts with key takeaways to support agency decision making.
How it works
1. Define the park
Provide a boundary file or let us confirm/draw one with you. We'll then schedule a kickoff meeting to confirm your scope and goals, execute a simple agreement, and get started.
2. Process the data
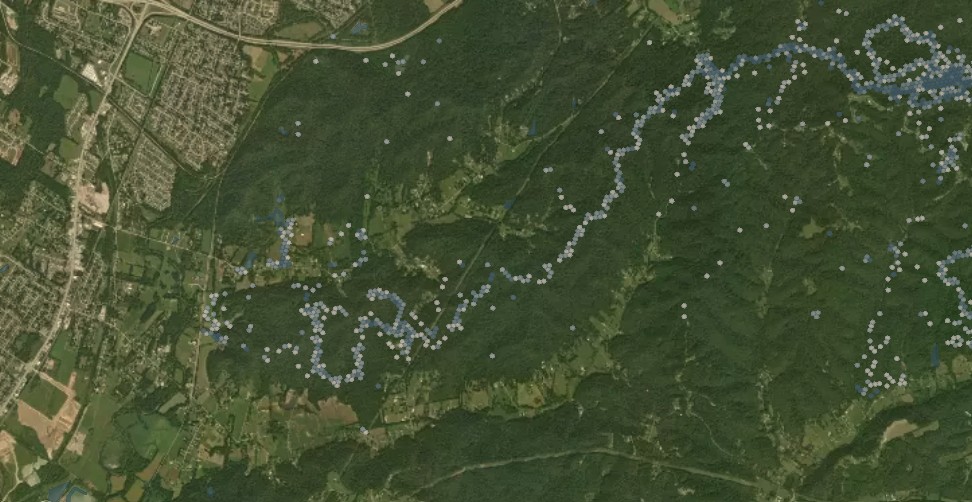
We run your site through our established mobile-location ETL pipeline, filtering pass-through traffic and removing non-visitor signals to protect privacy.
3. Deliver the results
We prepare the PDF and enable dashboard access, typically within three business days of scope confirmation and agreement execution.
What you receive
Pricing
Our pricing is structured to provide cost-effective insights for one or more parks. Listed prices include data procurement, analysis, and report preparation. For a limited time, 1 year of dashboard access is included with any purchase.
All packages include PDF report and introductory dashboard access.
Frequently asked questions
No. Mobile-location data are best for patterns and comparisons (when people visit, where they come from, how long they stay). We do not present it as a precise turnstile count.
All results are anonymized and aggregated. We do not identify individual devices or people.
A park boundary (if available), a short confirmation of the study period, and a point of contact for quick questions.
Yes. We can extend this analysis with visitor spending and impact estimates, or scale up to a multi-site or system-wide study.
The PDF is the formal deliverable. The dashboard provides an easy way to review the same core metrics interactively.